Engineering Journal
Maintenance KPIs That Drive MMS Decisions

A maintenance system is only as useful as the KPIs it can produce reliably.
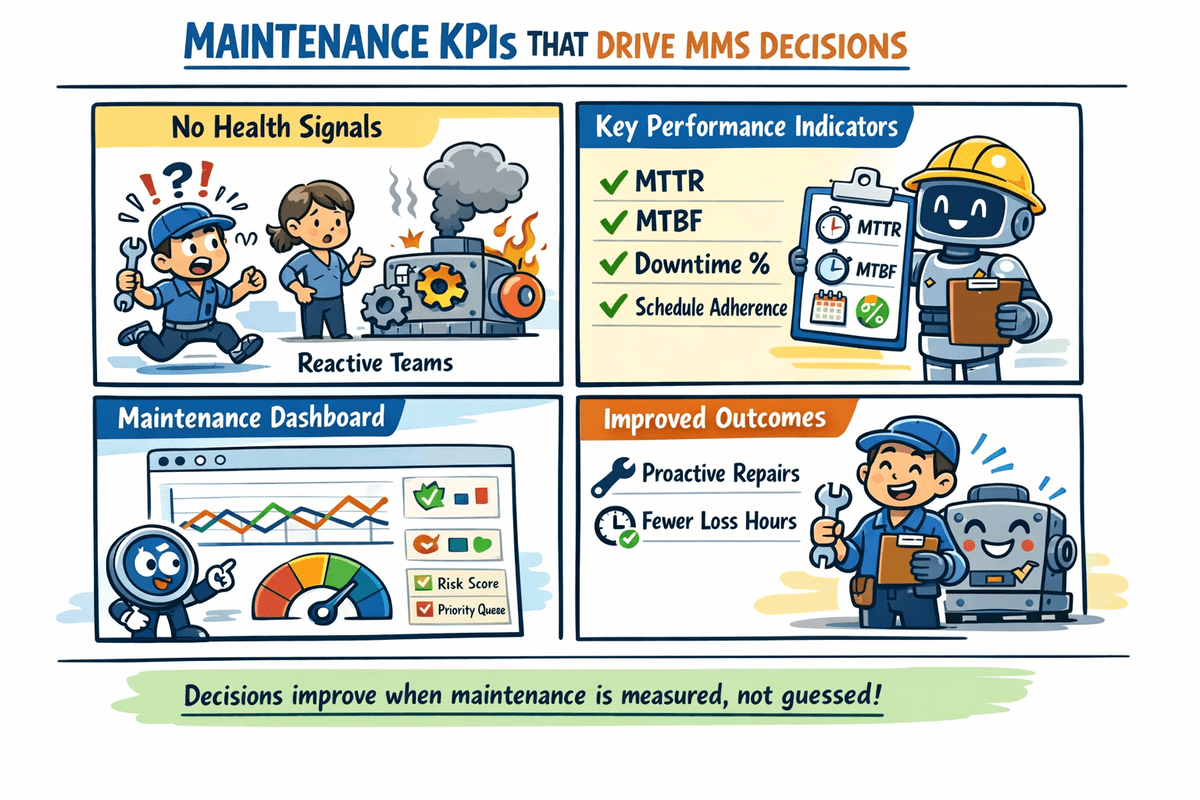
In our MMS design and review process, these metrics were central.
1. Total Ticket Completion Time
Total Ticket Completion Time = Response Time + Time to Repair + Supervisor Approval Time
This measures full cycle time from complaint to approved closure.
2. Average Response Time
Average Response Time = Total time to attend breakdown complaints / Number of breakdown tickets
This shows team responsiveness at incident start.
3. MTTR (Mean Time To Repair)
MTTR = Total machine repair time / Number of breakdown tickets
Lower MTTR indicates faster restoration capability.
4. Supervisor Approval Time
Supervisor Approval Time = Total supervisor confirmation time / Number of breakdown tickets
This captures administrative bottlenecks that often hide inside closure workflows.
5. MTBF (Mean Time Between Failures)
MTBF = (Total planned time - Total breakdown time) / Number of breakdown tickets
Higher MTBF indicates stronger reliability.
6. Zero Breakdown Machine Rate
Zero Breakdown Machine Rate = (Machines with zero breakdown / Total planned machines) x 100
This is a practical indicator of preventive maintenance effectiveness.
7. Total Downtime
Two useful expressions:
Total Downtime = Sum of breakdown durations + Planned maintenance downtimeTotal Downtime = Total operating hours - Total productive hours
This is one of the most business-visible maintenance outcomes.
Supporting Downtime Metrics
- Downtime Rate =
(Total Downtime / Total Available Time) x 100 - Availability Rate =
((Total Available Time - Total Downtime) / Total Available Time) x 100
Why These KPIs Matter Together
These are not independent numbers:
- MTTR and MTBF define reliability pattern
- Response and approval times shape completion cycle
- Total downtime affects availability and production outcomes
Practical Implementation Notes
- Capture event timestamps at each state change
- Keep status transitions explicit and auditable
- Use dashboards and threshold alerts for daily control
- Train teams to interpret metrics, not only collect them
Final Thought
When maintenance metrics are standardized and trusted, conversations move from "what happened" to "what should we improve next". That is where MMS starts driving strategy, not only operations.
Executive Snapshot
Reliable KPI pipelines turn maintenance from reactive incident handling into a continuous optimization discipline.
Reliability Signal
MTTR + MTBFRepair speed and failure spacing together define true maintenance health.Control Signal
Response + ApprovalProcess bottlenecks are often administrative, not only technical.Business Signal
Downtime + AvailabilityThese metrics directly connect maintenance outcomes to production impact.Event Capture
State timestamp discipline
Each workflow transition must produce reliable, queryable timestamps.
Metric Derivation
Formula standardization
Teams use one definition for each KPI to avoid conflicting narratives.
Operational Review
Dashboard-to-action loop
Threshold-driven alerts and review rituals convert numbers into daily decisions.